Examples / FAQ
This part of the user manual lists some examples of tasks being performed in Catana (in a FAQ-like manner).
If you want to see "examples in motion", you can find some Catana tutorial videos on the official YouTube channel of the MARILIA project.
How to show information about the loaded structure?
If you load a structure into Catana, you can click on the corresponding component in Workspace, then go to Inspector panel and finally Details tab. Section Structural parts will provide you with basic information about the contents of this structure, such as the number of chains and residues.
If you hover over a structure in the Scene view, a tooltip will appear, showing the information about the selected element. There are multiple formats of the tooltip's content, depending on the selected element.
In case of all-atom structures, the most common tooltip will have the following structure:
atom: [DA]29:B.C3' (3ugm.cif)
The structure encodes following information:
selected element: [residue name]residue index:chain name.atom name (structure name)
As for coarse-grained structures, the tooltip differs for DNA nucleotides, RNA nucleotides, and amino acids in the first word specifying the element type. Otherwise, the structure is identical. Thus, such a tooltip ...
DNA nucleotide: A (3ugm.cif:B[914])
... translates to:
selected element: residue name (structure name:chain name[global ID])
How to find residue with the given index?
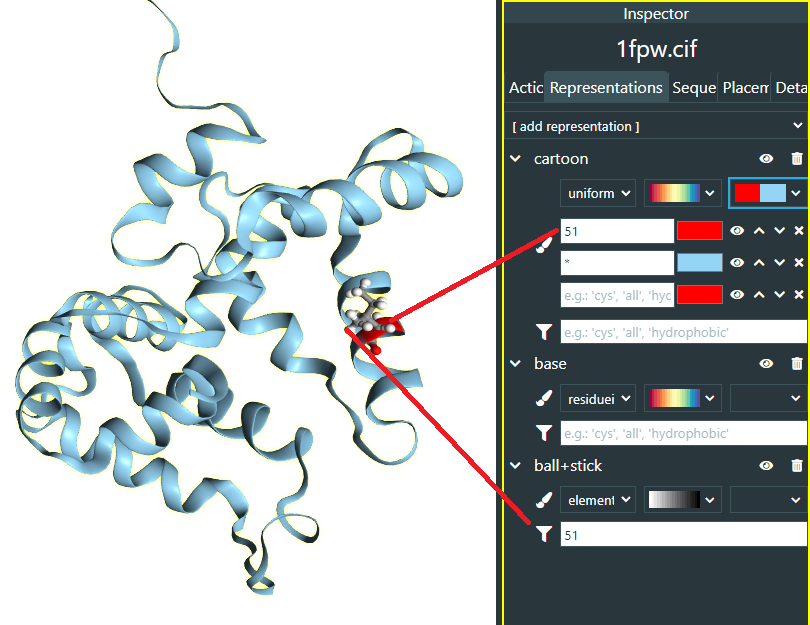
Simply load the structure (e.g., 1FPW as in the image below) and render it. Then, you can use the filtering feature to render only the given residue in the desired representation (e.g., residue 51 is only residue rendered in ball+stick representation below) or you can use the custom color schemes to highlight the part with the given residue (e.g., residue 51 is higlighted in red in the cartoon representation, while the rest of the structure, denoted as *, is blue).
How to render scaffold strand only?
Filtering language of Catana supports scaffold and staple keywords, allowing to selectively render or color only the respective types of DNA strands.
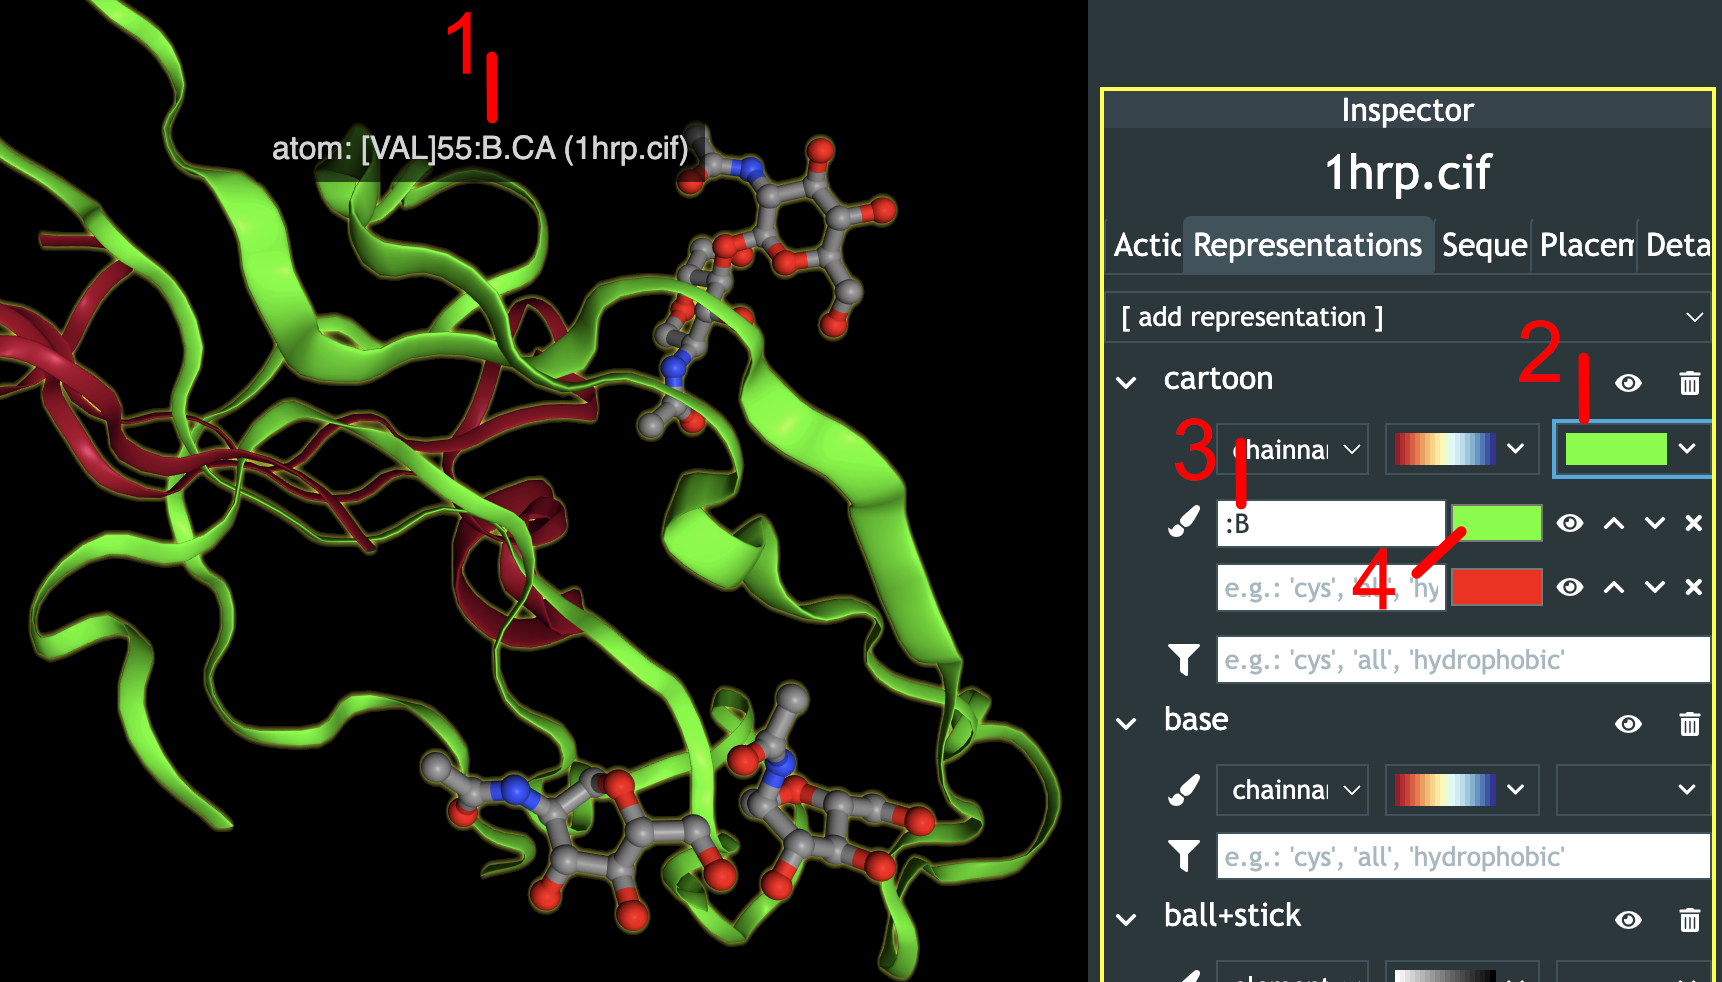
How to color a selected chain?
To color a given chain with the desired color, you will need to know the chain name and then input it to custom color schemes input panel while selecting the color to be used. The procedure is demonstrated on the image below.
How to export publication-ready screenshot?
In order to produce beautiful publication-ready screenshots:
- adjust the visual properties of the loaded structure, and
- position the camera so the structure is fully in view. It might be useful to change the Layout to Visualization to gain maximum screen space.
- Then, adjust the fog, background and graphics settings in the Scene Settings dialog.
- Finally, go to Structure-Export dialog, Screenshot tab. Here, set the resolution upscale to higher value than 1 to increase the screenshot resolution (2 or 4 might be sufficient). Then, consider if you want the screenshot to have transparent background or be trimmed to containg no empty space around the structures. Then, preview the screenshot and if you are satisfied, download it.
- That's it. :-)
Can I save the scene, i.e., somehow preserve the structures and their colors?
Let's say that you have a structure loaded and you changed colors of some of the residues to higlight them.
If you want to continue with this structure later, it would be verfy handy to be able to export it as a file with the coloring preserved, since exporting just a screenshot is not good enough.
Fortunately, Catana supports this functionality by modifying the exported UNF file to store such data (while stil remaining valid with the format specification).
Therefore, the only thing you have to do is to export the given structure as UNF and then load it next time. :-)
How to load oxDNA files?
This situation is demonstrated in the following video: https://youtu.be/2qnzeSlUbbo
Can I plot distribution of residues in the structure?
Yes, just head to Structure–Analysis menu and select the structure that should be plotted.
Can I visualize MARTINI coarse-grained force-field structures?
Yes, you can. :-) The best way to visualize such data is to load your structure and then to add backbone and martini-cg representations. The former shows the backbone trace, enabling to easily see the overall shape of the structure, while the latter visualization clearly communicates the locations of individual coarse-grained beads.